When I was with the Southwest Florida Water Management District, people often asked me, “What do you study at the district?” When I would respond with, “I study the water cycle,” they would chuckle and remind me that they learned
about the water cycle in sixth grade earth science class, and reply, “So why are Ph.D’s and engineers still studying it?” Then I would answer, “Well, it’s not quite that simple.”
How the Weather Model Actually Works
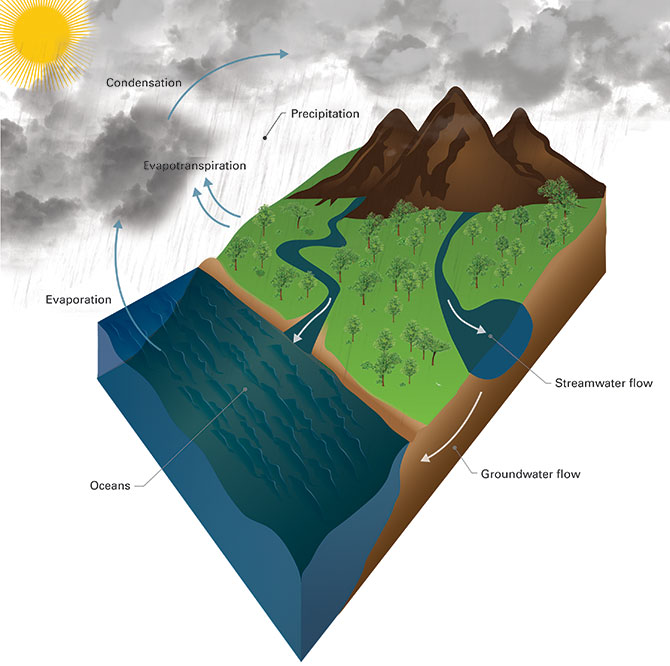
As we all remember in the cartoons from our earth science classes, the water cycle is driven by solar radiation that heats the atmosphere resulting in evaporation and transpiration, then as the atmospheric
water condenses, it falls back to the earth resulting in surface runoff into streams and lakes and/or percolation through the soils. Then, the cycle starts all over again. Well, it would be great if that was all there is to it, but of course, we alter
the land surface characteristics by constructing impervious surfaces (buildings, roads, etc.), installing stormwater retention ponds to handle surface runoff, and a myriad of other anthropomorphic alterations, which ultimately confound the “simple”
water cycle.
Then, the water really hits the road—actually the pocketbook—when we try to assign the risk of flooding to structures. The Federal Emergency Management Agency (FEMA) flood risk zones are used to determine the amount of flood insurance a homeowner
is required to carry on a bank mortgage. So, we use the water cycle to construct numerical and engineering models to evaluate and predict the flooding potential under different rainfall regimes. The numerical models are all based on water cycle parameters.
NOAA’s National Water Model
With this background, the National Oceanic and Atmospheric Administration (NOAA) constructed the National Water Model. This water cycle
model is a hydrologic modeling framework that simulates observed and forecast streamflow over the entire continental U.S. (CONUS). The model simulates the water cycle with mathematical representations of the different water cycle processes and how
they fit together. It allows the end-user to forecast water flows and levels for four configurations:
- Short range – cycling hourly and producing hourly deterministic forecasts out to 18 hours using current meteorological data
- Medium range – cycling four times per day ranging out to 10 days
- Long range – cycling four times per day and forecasting out to 30 days
- Hawaii short range – cycles four times per day and produces hourly deterministic forecasts
The results of the models are viewable through a web browser or downloadable from the National Centers for Environmental Prediction FTP site.
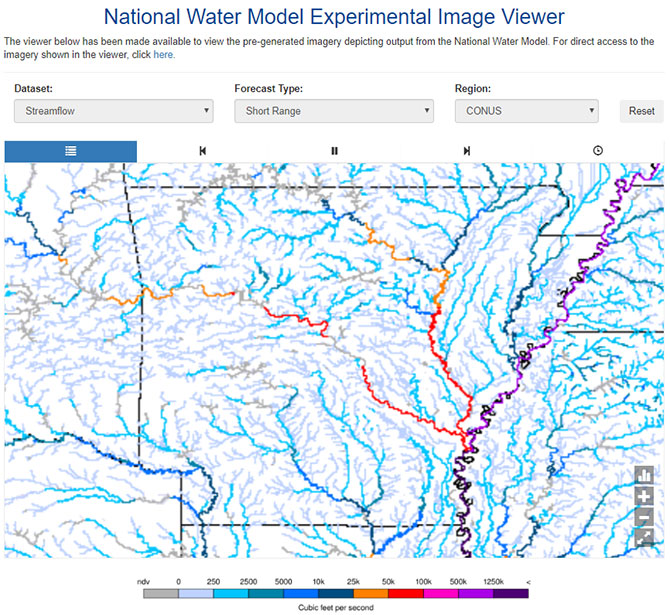
The National Water Model Experimental Image Viewer can be found here. The user selects three inputs (dataset, forecast type, and region) from the dropdown choices, runs
the selected model, and a graphic representation of the result is returned. In the example below, I chose: dataset = streamflow, forecast type = short range, and region = CONUS. The model ran for the entire CONUS and then I zoomed into Arkansas, where
there the model predicted enhanced river flows in the Mississippi (purple), White (red, yellow, and dark blue), and Arkansas (red, yellow, and gray) Rivers over the next day or so.
There is an old saying among numerical water modelers (and engineers), “All models are wrong, but some models are useful.” The National Water Model is an example of a very useful model.