In the early months of the COVID-19 pandemic in the U.S. there was a lot of uncertainty surrounding the continuity of the supply chain we rely on for the transportation of goods such as food, water, medicine, and personal protective equipment (PPE). Many
grocery stores were being emptied as a result of panic buying following closure and stay-at-home orders across the country, which led to the need for government agencies such as the Federal Emergency Management Agency (FEMA) to understand the health
of and ensure the continuity of the private supply chain delivering these critical commodities.
Monitoring the Resilience of Our Nationwide Transportation Network
On March 17, 2020, the Supply Chain Analysis Network (SCAN) was activated by FEMA to use data and analysis to highlight key supply chain features, structure, conditions, and relationships relevant to decision-making during disaster response. SCAN is a
partnership of subject matter experts, researchers, and analysts working for Center for Naval Analysis, the American Logistics Aid Network, the MIT Center for Transportation and Logistics, and Dewberry.
My team of traffic engineers formed the Traffic and Highway Assessment Team that worked in conjunction with other teams under the overall management of Dewberry Senior Program Manager Joe Goetz. Our objective was to track the volumes of freight trucks
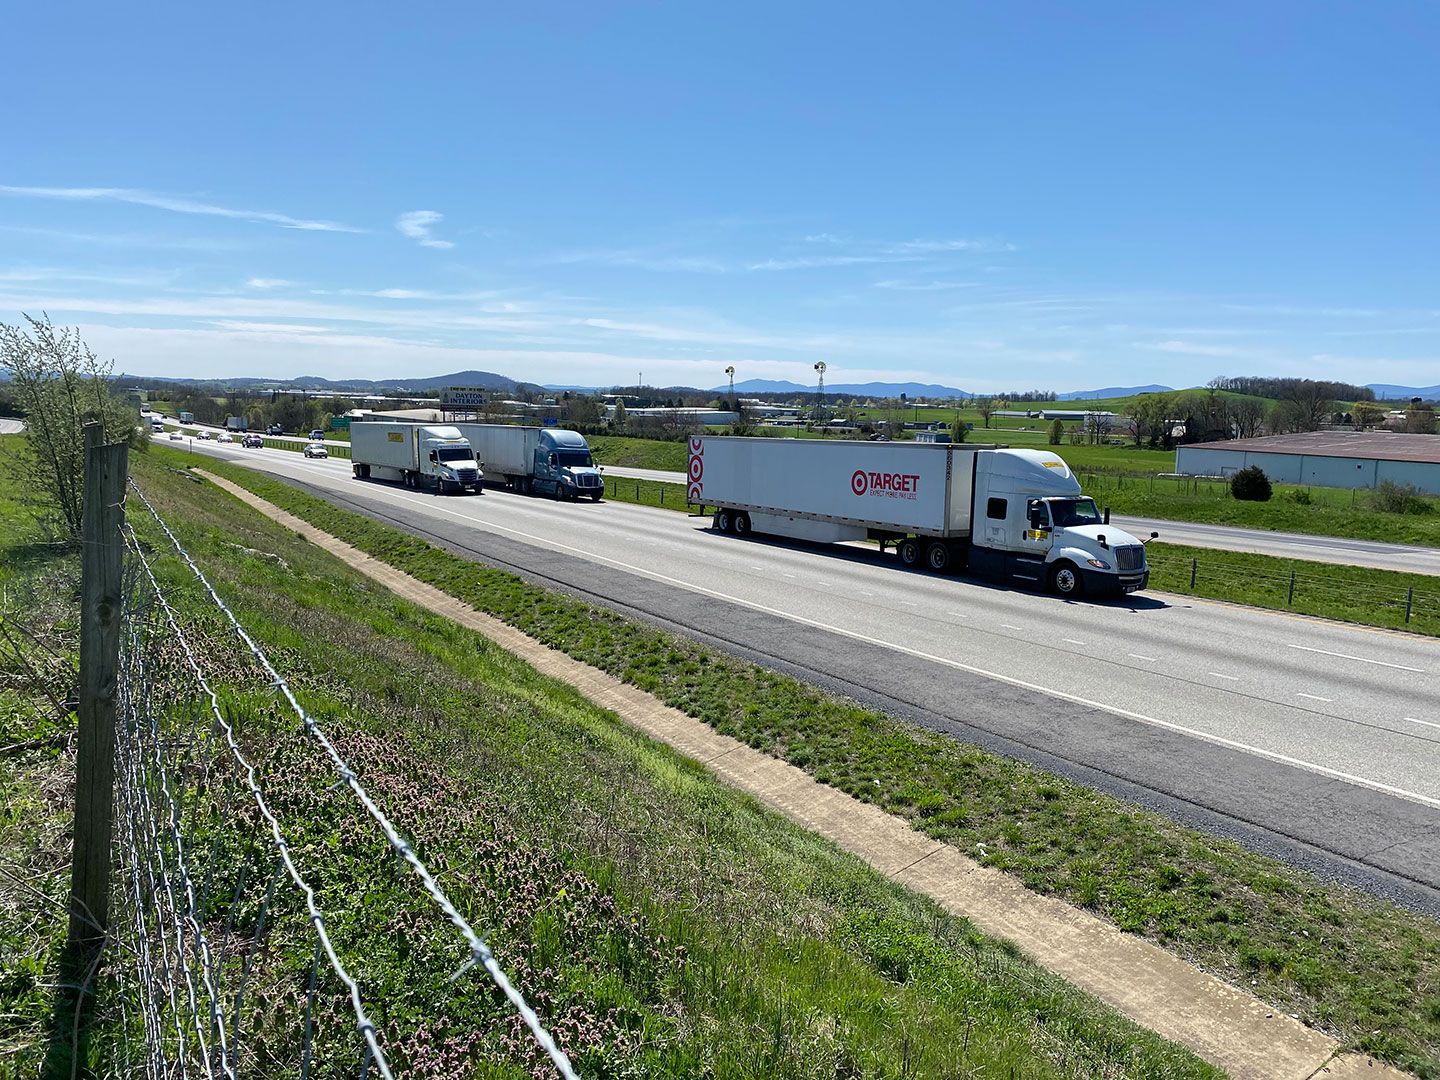
throughout the country in real-time to determine if there was a substantial drop in truck traffic. Semi-truck volume is a great indicator of whether the supply chain is operating efficiently, as trucks carry a high proportion of critical commodities
such as groceries and household necessities. This included the need to sift through volume data to differentiate large truck volumes from small trucks and personal vehicles. While commuter traffic had dropped off tremendously compared to prior to
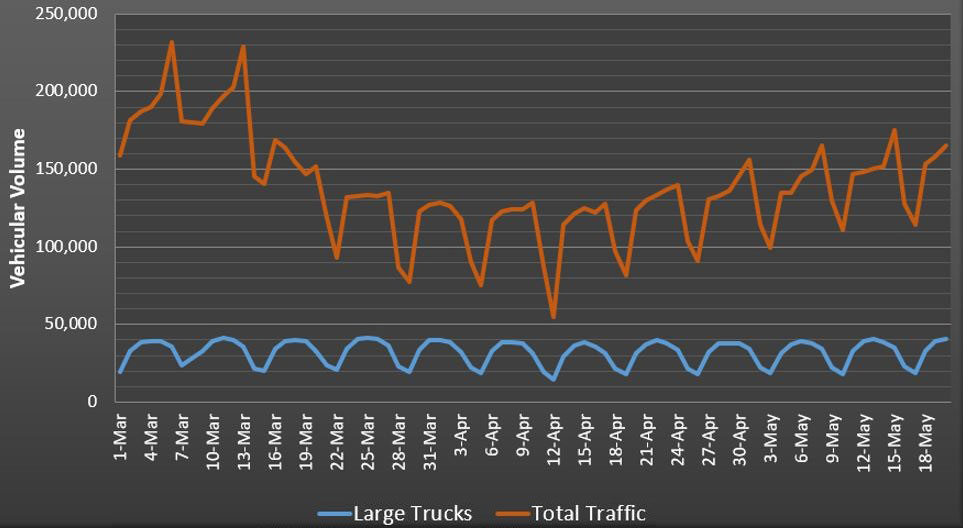
the pandemic, large-truck traffic, as we would find, had only dropped off around 5% to 20%.
 Sample volume trends from data analyzed in a Midwest state, exhibiting steady large truck traffic as compared to total traffic (all vehicle types). The cyclical dips represent weekends, where traffic volumes tend to be lighter. Of note is the precipitous drop in total traffic in March of 2020.
In addition to truck volume, we also tracked factors that could impede truckers from carrying out their duties. In some cases, we found that imposed checkpoints were slowing truckers from transporting goods. Another factor that we assessed was the operating
status of truck stops that are necessary for truckers to travel across country, including showers and diesel fuel stations. Additionally, our team analyzed whether there were any perceived barriers to truckers that could deter them from their work.
For example, we closely monitored truck volumes in areas that were considered “hot spots” for the virus or under quarantine rules at that time.
Challenges to Real-time Truck Volume Data Collection
One of the biggest challenges that we faced in collecting the traffic data was the need to collect it in nearly real-time. Under normal circumstances, collecting traffic data for engineering assessment includes a field data collection and quality control
process whereby data is typically compiled and distributed two or more weeks after it is captured. Because of the urgent need to assess rapidly shifting ground conditions, we needed to find a different method to attain the real-time, detailed data.
We started by leveraging existing relationships with departments of transportation and toll agencies, many of which granted us emergency access to real-time roadside continuous count stations and toll transaction data. Over time, relationships were
built with additional agencies across the country, resulting in access to daily class-specific volume counts on critical freight corridors nationwide.
Once we gained access to the real-time data, our team quickly downloaded the data, worked through our own quality control process that identified and eliminated erroneous data, and then graphed it in a visual format to begin the analysis process.
 We performed traffic data collection analysis, assessment, monitoring, and developed recommendations for regional and national emergency managers from March through June 2020.
We’ve established a process to quickly acquire and assess traffic data. This project has also provided the opportunity to build and strengthen relationships with many transportation agencies, which should help expedite the data transfer process in the event of a future disaster."Jerry Mrykalo
“Hyper-Speed” Traffic Studies: Preparing Ourselves for Future Disasters
The processes set in place by the work completed over the course of the pandemic will help us better prepare for future disasters. We’ve established a process to quickly acquire and assess traffic data. This project has also provided the opportunity
to build and strengthen relationships with many transportation agencies, which should help expedite the data transfer process in the event of a future disaster. In fact, this process has already been put into good use as we were able to quickly acquire
traffic data along the Gulf Coast to assist with several hurricane-related SCAN activations in the summer and fall of 2020.