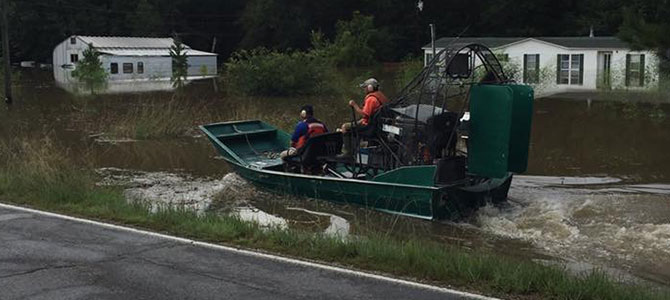
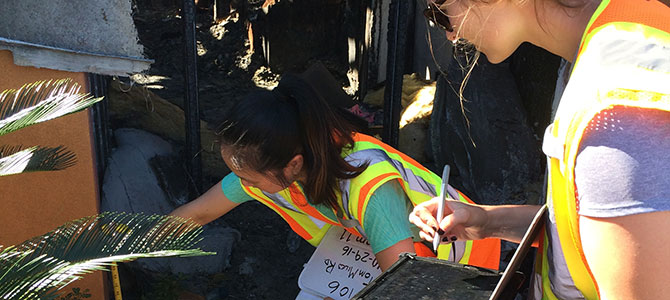
More than 50 Dewberry employees from four offices have been involved in assisting FEMA following the Louisiana floods this past summer and Hurricanes Hermine and Matthew in the fall. Responsibilities have included development of critical flood depth grids to determine impacts as well as thousands of damage assessments in the field. Here, employees from the Fairfax and New Orleans offices share some of their "rapid response" experiences.
Helping Local Communities
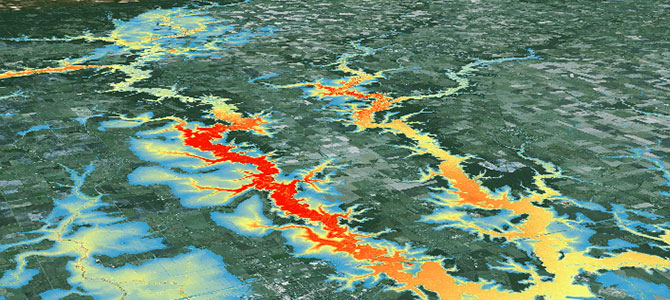
Seth Bradley, an engineer in the New Orleans office, began working to provide information to FEMA shortly after the August flooding in Louisiana began. "I worked with Chris Sliwinski in our office to come up with a method to create a flood depth grid, measuring the depth of the flooding and the impact on structures. We had a 48-hour turnaround to report the initial findings to FEMA. We had done something similar in the past, but not in this timeframe. Some rivers hadn't even crested yet. Later, I was tasked with field damage assessments, working six days a week performing 30 to 40 assessments a day."
Seth has seen his share of damage due to flooding, both along the East Coast and close to home. "This is the fifth major field effort I've been assigned to. I also performed damage assessments following Hurricane Isaac in southern Louisiana, twice in New Jersey following Superstorm Sandy, and last May I worked in Houston following the ‘Tax Day Flood.' This one really hits close to home though. My parents' home in Ascension Parish was flooded. They could barely get out of their neighborhood. I appreciate getting to know people from other offices. I grew up around here, and it's great to be able to help the local communities and be a part of the recovery process."

Long Hours
Chris Sliwinski, a geographer in the New Orleans office, worked closely with Seth Bradley to meet FEMA's deadlines for the flood depth grids. "When Seth and I were tasked with preparing the flood depth grids with such a short turnaround, we brainstormed what sort of data sources would be readily available and how we could possibly use them. Louisiana is one of the few states completely covered by lidar data, so we used that for our ground elevation data. We downloaded the areas we needed from a Louisiana State University website. We also used stream and river gauges—there are never enough—and we had to vet each one as some had malfunctioned or been overtopped. We updated this data regularly as some rivers didn't crest for more than a week. The gauges covered a huge region, from Lake Charles to Folsom. We supplemented the gauge data with high water marks collected by FEMA inspectors. Using the gauge data and the high water mark information, we created a water surface grid of the flood using an interpolation method known as a Triangulated Irregular Network (TIN). Then, we subtracted the ground elevation from the water surface elevation to get a flood depth grid. There were many steps, a lot of math, and a lot of long hours but it was rewarding to know that the information was used to help those impacted by the flooding."
High-Quality Deliverables
Tom Moran, a geospatial analyst in the Fairfax office, also supported the effort to create the flood depth grids. "For the Louisiana flooding response, my first assignment was helping Chris Sliwinski with the flood depth grids. We were sourcing data—what's available, what's usable—from places like the National Oceanic and Atmospheric Administration (NOAA) and local and state authorities. The grids were used to determine the impacted parishes, and the number of affected structures. Our first assessment estimated that about 150,000 structures had been impacted. Later, we did similar work following Hurricane Matthew. By that point, we were pretty well-oiled at producing high-quality deliverables in a short timeframe. We knew what was going to work and what wasn't. We've streamlined the process. Employees contributed from Fairfax, New Orleans, Richmond, and Tampa. It was interesting to learn about everyone's expertise using geospatial technologies for rapid response. It was fast-paced work for an important cause."

Around-the-Clock Effort
Siddharth Pandey, a senior geospatial analyst who also supported the post-flood response effort from the Fairfax office, was impressed with the strong sense of teamwork throughout the process. "During the four days of the Louisiana flooding in August, we were using event-specific imagery of affected areas, to identify structures that were impacted. We were creating point locations on structures using imagery. The flood depth grid helped us to determine the depth of flooding, which we validated with the post-event imagery. We worked 12-hour shifts for two weeks. I was impressed with how quickly the work was making it to FEMA, and how quickly FEMA was then able to help residents. I also spent a week in Calverton, Maryland, setting up databases for the damage assessments and then checking assessments in a QA/QC capacity. It was a great experience to work with the other companies involved. I've never been part of a project where so many people were willing to fill in for each other when another got busy. It's been great to see so many of my co-workers, both back office staff and inspectors in the field, step up on numerous occasions to help each other out and get the job done when we needed the extra push."
Real-Time Evaluation
Jeff Gangai, a senior associate in the Fairfax office, notes that processes that used to take weeks have been significantly streamlined, thanks to new tools and technology. "The GIS capabilities are so much better today as an analytical tool, and having the digital topographic data as well—none of that was available in the past. Following storms like Ivan and Katrina, it took weeks to produce and validate the flood maps. Now, it's almost a real-time evaluation of impacts. We're generating the flood depth geospatial data in 48 hours and then analyzing it for impacts on properties and structures. We're doing it more quickly than ever before, and we're tracking down the most comprehensive data to create the best product. For Hurricanes Hermine and Matthew, we started to collect topographical information before the storms even hit so we were ready to go."

A Great Learning Experience
Rebecca Hernandez, an administrative assistant in the New Orleans office, supported the post-flood response effort in several ways. "I helped with gathering parcel data from communities for the flood depth grid, including the property boundaries and building footprints. Our office developed the flood depth grid and validated the flood extents using imagery from NOAA, the Civil Air Patrol, and social media. We tied the analysis to the parcels to show the impacts to residences, structures, and commercial buildings. It was a challenge—some communities were so small, they hadn't been mapped, or they didn't have a GIS department. Many of the communities had been so damaged by the flooding, they were running with skeleton crews. But we kept following up to try to get the best information we could to FEMA. Later I was assigned to help with the damage assessment teams. I helped with booking accommodations for the team members, and sometimes I would go out in the field myself. I understood what these residents were going through. We went through Hurricane Katrina. Our house was flooded and we had to move to Houston for almost two years. My parents lost a great deal. But Louisiana is a resilient state. Now, I'm in my junior year at Tulane University, working toward a degree in homeland security. Our work for FEMA has been a great learning experience."