El Niño is one of the most important climate phenomenons on Earth, also known as El Niño Southern Oscillation (ENSO) which includes La Niña, it is the most powerful oscillation and consists of a fluctuation of complex ocean currents. While oscillations occur naturally in oceans across the world, ENSO is an example of an oscillation having a greater impact on our climate with effects felt globally. This oscillation is caused by an alteration in wind patterns, resulting in a change in the temperatures between the atmosphere and the ocean. The unusually warmer air leads to an oscillation between cooler and warmer waters, resulting in above average ocean temperatures.
El Niño changes irregularly every two to seven years, triggering disruptions of large-scale air movements. The effects of El Niño include fewer hurricanes and tropical storms in the North Atlantic, milder winters in southern Canada and the northern continental U.S., replenishment of water supplies in the southwest U.S., drier weather in the Pacific Northwest, wetter weather in Southern California, abnormal fish migrations along the Pacific coast of South America due to cooler water temperatures, and heavy precipitation patters that can cause flooding in the Gulf Coast states.
Updating Lidar Data
The disruptions caused by El Niño have significantly altered ground conditions along the West Coast to the point that the current topographical maps are out of date. Our geospatial team, along with subcontractor Towill, was selected by the U.S. Geological Survey (USGS), the National Oceanic and Atmospheric Association (NOAA), and the U.S. Army Corps of Engineers (USACE), to produce and process new elevation models for the narrow corridor stretching along the West Coast. A flight boundary was created from the U.S. and Mexico border to Port Townsend, Washington, equating 486 square miles of the Washington and California coast lines, as well as 44 square miles of USACE-defined harbors and waterways.
The updated elevation models will reflect the ground conditions on the coast post El Niño for use in various environmental and ecological studies. The geospatial team is currently processing the data to determine what magnitude the beach and cliff faces along the coast have changed since the last measurements, as well as seeing how impactful El Niño has been along the West Coast.
Flying the Coast
The accuracy of the lidar data collection relies on the prediction of plus/minus two hours of low tide, in order to have uniform data showing as much of the coast line as possible. Ironically, the abnormal weather conditions in Southern California and the Pacific Northwest caused by El Niño aided in our data collection by making notoriously cloudy areas more clear.
The geospatial team collected the lidar data and flew the entire coast within a one-month timeframe and as the project manager, I was very impressed with my team. We were able to successfully get permission from the international airports along the coast to fly in their airspace to collect the data, as well as permissions from military bases. We ran into some issues with national parks in California because our helicopters were disturbing seals that inhabit areas along the coast, but we still completed the data collection on schedule. As you can imagine, the team was able to collect multitudes of amazing imagery along the way.
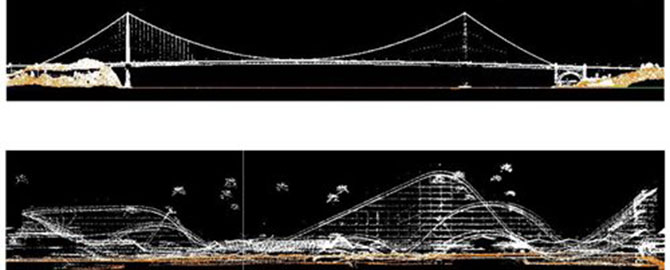
 The images above show lidar profile views of the Golden Gate Bridge and the Giant Dipper rollercoaster located on the Santa Cruz Boardwalk.
After Effects
According to analyses by NASA and NOAA, earth's temperatures in 2015 were the warmest ever recorded in history. With evidence that humans have contributed to the increase in greenhouse gases, there is a possibility that El Niño also significantly contributed to earth's warming. We hope the results of our data will lead to new findings about this phenomenon and help government entities plan for the future.