Most lidar projects are big—really big. From the 1,200-square-mile coverage of the Everglades National Park in Florida to almost 42,000 square miles in Texas, our firm has worked on multiple large projects with the U.S. Geological Survey (USGS) with varying scope and scale. A more recent project with USGS that we are conducting in Fairfax County, Virginia, has us
covering a smaller footprint at under 1000 square miles. In addition to being a smaller scale project, the end client wanted “Quality Level 1 Lidar,” which meant a much greater point density. While our Fairfax County project is smaller
than other lidar projects, it doesn’t mean it isn’t just as valuable. In fact, there is a plethora of useful applications, including the ability to examine all of the watersheds that come in and out of the county.

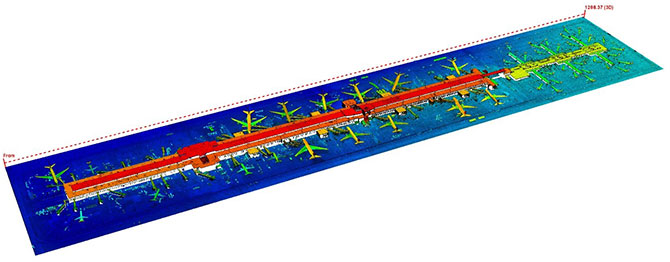
This scan shows an oblique view of Tysons Corner in Virginia. The point cloud is colored by elevation with blue showing the lower and red the higher elevation. If you are familiar with the area, then you can likely make out the Tyson Center building on
the far left.
What is Dense Point Cloud Lidar?
Our client had us increase the density of the breakline that we'll collect. Breaklines are used to enforce breaks or changes—typically abrupt changes—in the terrain or ground surface model. Breaklines enforce areas where the lidar data
typically don’t map the features well or completely. We utilize two methods of collection—the first is manual and requires an analyst to pan through a data set to identify features and digitize them. The second method is more automated
where an analyst assigns values to known waterbodies, and then a program uses those defined parameters to identify similar features. A dense point cloud means we have a more saturated amount of points within a given 3D space. This increased
density allows us to identify more water bodies at a smaller scale. Instead of the normal two-acre sized ponds, we're collecting one-acre ponds, which more than doubles the amount of waterbodies. We’re similarly taking a look at streams in the
county, and the increased density has added more than 50 miles of a variety of streams, including Bull Run, Pohick Creek, Accotink Creek, and Difficult Run. The technology has gotten so advanced that we’re even able to gather data points
down storm drains on streets. Ultimately, the data will be used for flood analysis, but there are a lot of other exciting and fun applications.
How to Create a 3D Point Cloud
After some initial planning work, we had an acquisition partner use a plane to run 40 flight lines in six missions to collect data using a laser ranging device.
The pilot flew straight lines across the county back and forth. What made these flight missions unique is that we had to change the project layout because of Washington, D.C.’s restricted airspace, which includes the Naval Observatory and the
White House. Due to the restrictive nature, we ran a couple of our missions with Secret Service onboard.
The data then gets calibrated and processed through several automated routines that classify the point cloud to ground and non-ground points. Our geospatial staff then conduct manual classifications that result in a ground model that can be used for floodplain
management, stormwater management, stormwater runoff analysis, and much, much more.
Endless Applications of Data
While our work for Fairfax County was mainly for mapping watersheds, we can perform thousands of different applications with the lidar data, including vegetation canopy mapping, building rooftop identification, road network creation, contour mapping,
and slope derivation. For example, when you remove the data points for vegetation and buildings, you can conduct historic analysis to see pre-1950s farm roads, old railroads, Civil War monuments, and even battlefield craters. Another application for
the data might be seeing the solar potential for your building using modern geospatial software that looks at the height, slope, and surface area of your rooftop from the lidar data and compares it with the length of time the roof will be exposed
to the sun’s rays. On my own time, I was able to pull data of my house to plot out where the best place would be to plant my tomatoes! If you can dream it, you can likely do it using modern lidar data.
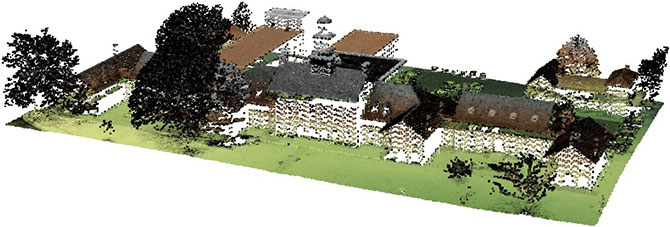
Originally constructed in 1799, the historic Fairfax County Courthouse is located at the intersection of Little River Turnpike and Chain Bridge Road. The above screenshot contains 168,793 lidar points of data.
This screen shot of the Dulles International Airport located in Fairfax County contains 9,699,134 lidar points of data.