Bridges and culverts have traditionally been designed assuming there will be no significant long-term changes in rainfall intensities and patterns. Evidence suggests, however, that the climate is changing, and this will result in different rainfall intensities
and patterns from those experienced in the past. The effect that changes in climate will have on existing and future bridges and culverts is uncertain, but using current scientific understanding and engineering judgement, this change can be estimated
and incorporated into bridge and culvert designs to balance risk across a structure’s lifespan.
The Study
While working as a post doctorate research associate for the Department of Engineering Systems and Environment at the University of Virginia, I conducted a study that examined the potential impact of changing climate conditions on structural designs in
Virginia. This study resulted in recommendations that the Virginia Department of Transportation (VDOT) could use to update their design standards involving stormwater runoff and stream flows.
The study is broken down into four main objectives:
- Evaluate and validate an existing Dewberry study and extend to time spans through 2100 as well as 100-year return periods of interest to VDOT
- Investigate the relationship between increased rainfall, runoff, and watershed area for a variety of storm events
- Provide equivalent risk assessment methodology to determine appropriate design criteria
- Repeat the rainfall analysis for other regions in the state to better understand the potential impacts of regional variability in rainfall
The Methodology
For objective one, a methodology was developed for producing intensity-duration-frequency (IDF) curves verified against the standard Atlas 14 values. To conduct this, we collected daily rainfall data from the Norfolk International Station in Virginia.
Global Climate Models from the World Climate Research Programme’s Coupled Model Intercomparison Project Phase 5 and Downscaled Regional Climate Model outputs were obtained from the Coordinated Regional Climate Downscaling Experiment and used
to project changes in future precipitation IDF. The results suggest increases in rainfall depth for a 24-hour rainfall event and support the findings in the Dewberry study.
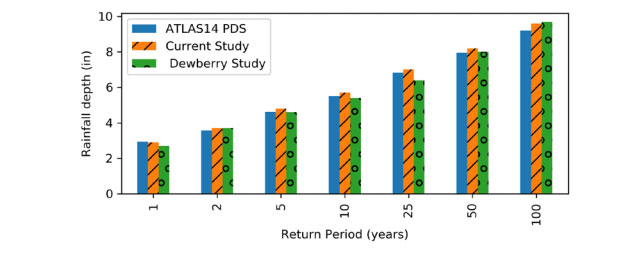
The above figure shows the comparisons between Atlas14, the historical IDF values in the current study and the IDF values from the Dewberry report for the Representative Concentration Pathways (RCP) 8.5 emission scenario.
The second objective used a 2D hydrodynamic model called TUFLOW (Two-Dimensional Unsteady Flow) to assess increased rainfall volumes on peak runoff volumes, suggesting smaller watersheds have a constant relationship between peak runoff and watershed size,
while larger watersheds have less than 1% increase in peak runoff as the watershed size increases.
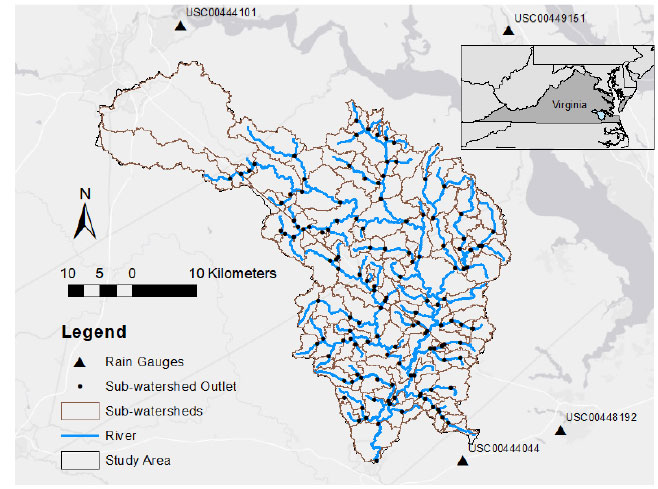
The above graphic shows TUFLOW modeled domain and sub-watershed domains and outlets where peak flows were computed under current and future conditions.
The third objective illustrated average annual risk over the lifespan of a culvert and a bridge. To compute this objective, we used an average annual risk (AAR) formula which demonstrated a simple but effective approach for balancing risk over
the life of a structure assuming non-stationarity conditions. AAR was selected because it also complements the results of the other objectives in this study.
Finally, the IDF approach in the first objective was applied on multiple stations across the Commonwealth and showed significant variability across individual stations, but no obvious spatial trend across the Commonwealth. Both the coastal plain region
and the piedmont region have stations with larger increases of rainfall and others with smaller increases, with no obvious spatial pattern. For example, the largest increase in terms of inches is 6.6 and is located in the Middle Peninsula of the Hampton
Roads region. However, the station closest to it has an increase of only 2.3 inches.
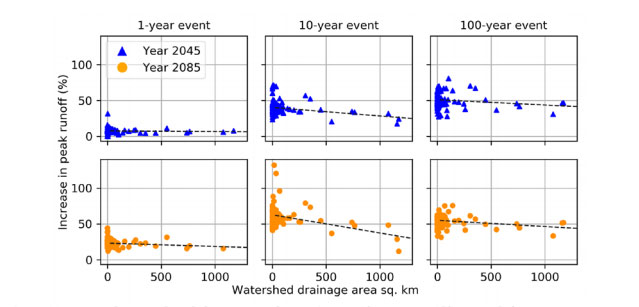
The above figure shows the percent increase in rainfall volumes for the 1-year, 10-year, and 100-year rainfall events under the RCP 8.5 emission scenario.
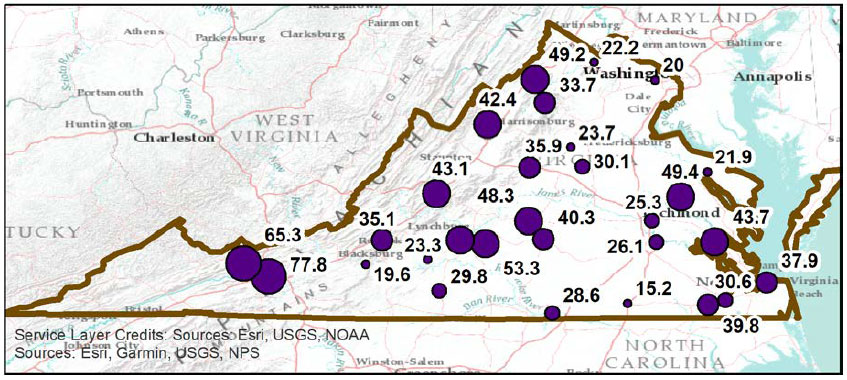
The percent increase in 100-year storm event across the Commonwealth of Virginia for the year 2085 and the RCP 8.5 emission scenario. The diagram suggests that there is no obvious relationship in percent increase in inland versus coastal, north versus south, or other spatial trends.
Our Recommendations
Based on the results of our study, we recommended that VDOT use the findings from this study to update the design standards involving stormwater runoff and stream flows. When VDOT assets are designed using rainfall data, the values should be increased
to account for the greater rainfall predicted and reported in this study. When VDOT assets are designed using discharge data not derived from rainfall, the values should be increased to account for the greater discharges predicted and reported in
this study.
Implementing our recommendations will help new VDOT roadway drainage elements better accommodate increased precipitation volumes and associated discharges predicted over the lifetime of the structures. Integrating the estimated non-stationarity values
reported in this study into structure design can maintain the originally specified level of risk over the course of a structure’s design life. VDOT will also be able to confirm that new stream crossings elements better accommodate increased
discharges predicted over the lifetime of the structures.
Read the entire study online here.