Web-Based Analytics Lead to Smarter Capital Planning and Risk Management
As an engineer, one of the most exciting developments I've seen in the past few years involves the harnessing of "big data," or large and complex datasets, for asset management, capital planning, risk assessment, and program evaluation. With modern computing power, algorithms that can efficiently handle millions of records, and the development of interactive data visualization software, multiple large datasets can be converted into clear and comprehensible dashboards that are easy to navigate. Many public agencies--and more and more private-sector organizations--are now relying on big data analytics to provide context for initial decision-making, course correction, and program validation. We find that the dashboards also help our clients discover insights on trends, anomalies, and narratives within their data.
What's the Potential Impact? Assessing Flood Risk
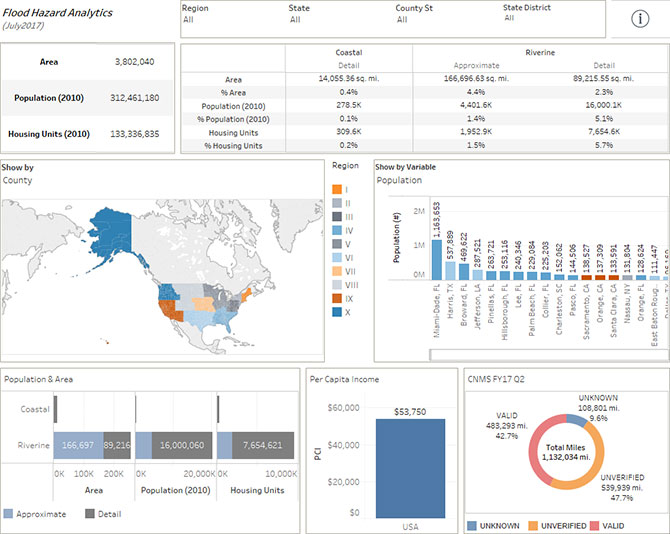
As a specialist in risk assessment and the development of resilience measures, I've been involved in the development of a comprehensive Flood Hazard Data Analytics dashboard for use by the Federal Emergency Management Agency (FEMA). Using Tableau visualization software, this dashboard was launched in 2016 as part of our Strategic Alliance for Risk Reduction (STARR II) contract, which supports FEMA with mapping, risk assessment, mitigation planning, and risk communications. We update the dashboard monthly, providing a summary of population at the national, regional, state, congressional district, and county levels using data from FEMA's National Flood Hazard Layer and Coordinated Needs Management Strategy (CNMS) as well as U.S. Census Bureau data and boundary information from the U.S. Geological Survey. With sweeping layers of information and context now available at their fingertips, FEMA officials use the dashboard to explore the reach and impact of the National Flood Insurance Program at multiple scales, from a national perspective all the way down to a local Congressional District.
Also for FEMA, we created a Levee Analytics dashboard. This tool contains nationwide information on the number of levees, miles of levees, accredited or non-accredited status of levee structures, type of structure, and population potentially impacted by a levee breach or failure. The national data can be accessed down to the county level, enabling officials at all levels to query the program, assess risk, and plan accordingly.

FEMA's Flood Hazard Data Analytics dashboard supports detailed flood risk assessment for specific populations, using the agency's own flood hazard area data as well as datasets from the U.S. Census Bureau and the U.S. Geological Survey.
Identifying Priorities for a Statewide Road Network
At the state level, we have worked with the New York State Energy Research and Development Authority to create an analytics tool that supports the capital planning efforts of the New York Department of Transportation (NYSDOT). The dashboard provide access to layers of information that address numerous factors in the determination of funding priorities: road capacity, maintenance and operational requirements, placemaking and sustainability considerations, safety, resilience, and socioeconomic factors. With extensive information in hand, NYSDOT officials are able to analyze potential projects according to multiple criteria, leading to clear, data-driven determinations about capital planning priorities.